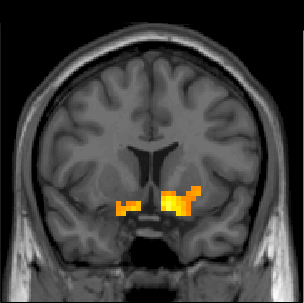
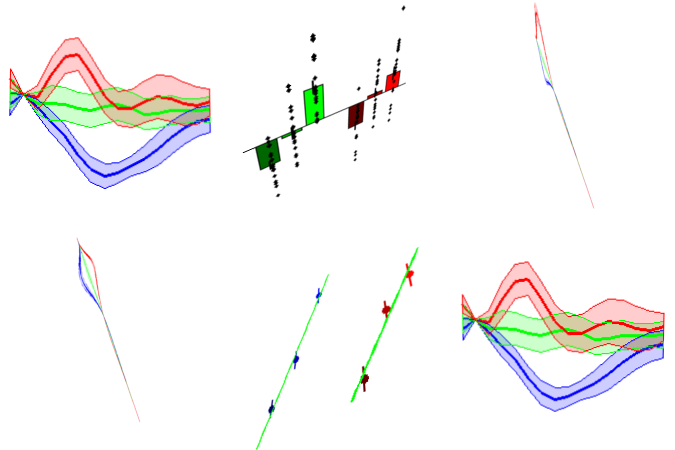
rfxplot is a versatile toolbox for SPM5 which offers plotting effect sizes, fitted responses, and BOLD time courses averaged across subjects from within 2nd level (random effects) analyses. The toolbox offers a large variety of plot configuration both suitable for data exploration and producing high quality figures for publications


